Next Generation of Epoxies for Structural Applications
Nanocomposites with Enhanced Strength and Toughness
Project Sponsors
Executive Unit for Higher Education, Research, Development and Innovation (UEFISCDI)
IDEI PN-II-ID-PCE-2011-3-0120, Contract no 293/2011
Faculty Participants
Catalin R. Picu
Professor
D. Constantinescu
Professor
Marin Sandu
Professor
Stefan Sorohan
Professor
Current and Former Students
Dragos Alexandru Apostol
Post Doctoral Researcher
Ioana Cosmoiu
Graduated in Dec. 2015
Introduction
Polymer nanocomposites are materials of great current interest due to their fascinating set of properties. Most impressive are not necessarily the gains obtained in a given property relative to the behavior of the neat polymer, rather it is the interesting mix of properties that results when mixing nanofillers and polymers. For example, one may improve at the same time both the strength and the ductility (which is generally not feasible with regular materials), one many have a material which is transparent to visible light, opaque to UV, tough and scratch resistant at the same time. Adding only 3-4 vol% of nanoparticles to a brittle polymer (PMMA), and insuring good dispersion, the polymer becomes ductile, with strains to failure above 30%. Most importantly, this does not entail a loss of strength. Other examples are protective thin films for automobile windshields and airplane windows which act as UV filters, which are non-sticking therefore reducing ice formation and accumulation, and have enough mechanical strength to survive indents and scratches. Likewise, silicone resins containing multiwalled carbon nanotubes (MWCNTs) were shown to prevent marine organisms from adhering to coated surfaces of cruising boats; the anti-fouling properties are due to the nanostructure of the coating which is not toxic for the marine life.
The exceptional properties of nanocomposites originate from the interaction of the organic (polymeric) matrix and the inorganic fillers. The filling volume fraction is typically below 5%. If one keeps the volume fraction constant and reduces the dimension of fillers, the average filler-to-filler distance decreases. Hence, essentially the entire matrix material ends up being in the close proximity of a filler surface. This modifies the properties of the matrix, i.e. the respective nanoscale volume of material has modified stiffness, dissipation, dielectric relaxation relative to the same volume in a matrix region with no fillers. Hence, while in regular “microcomposites” (composites filled with micro-scale inclusions) fillers are added to directly enhance strength, in nanocomposites fillers are used to modify the matrix material. The resulting matrix has the properties of the unfilled polymer in regions away from filler surfaces, and modified properties close to these inclusions.
It is generally known that properly distributing the nanofillers in the matrix is key to obtaining interesting properties with given nanocomposite. Poor filler dispersion leads to the complete loss of performance and, in some cases, to even worse properties than those of the unfilled base polymer.
In this work we study epoxy-based composites with various types of nanofillers, including carbon nanotubes, and ceramic nanoparticles. The objective is to improve the toughness and creep resistance, without reducing the elastic modulus and the strength.
Approach
The work has experimental and modeling components. Experimentally, we explore various methods to produce these materials, and perform macroscopic testing to determine the properties of interest (strength, ductility, toughness, creep resistance and fracture toughness). To this end, we use the experimental facilities described in the Resources section.
Modeling is performed to determine the effect of the spatial distribution of fillers on the material-scale properties. Specifically, we explore the possibility to distribute fillers in a spatially correlated way and the effect of such distributions on mechanical properties. Continuum-level modeling using finite elements are used in all cases.
Results
Experimental
The experimental work had three thrusts:
Manufacturing composite materials with various compositions,
Characterization by mechanical testing: uniaxial, quasi-static loading,
Characterization by creep and impact loading.
The overall objective of the work is to optimize the processing method to obtain improved mechanical properties. Below, We report results obtained to date.
Processing method
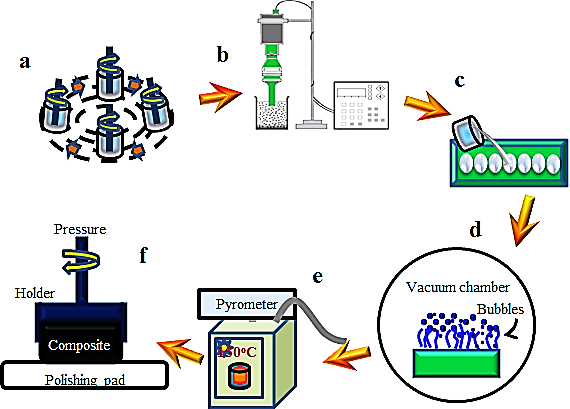
The method used currently to produce nanocomposites is shown schematically in Fig. 1 and includes:
Mix the resin and the nanopowder/nanotubes using a shear mixer for 10 minutes at 1500 rpm;
Continuous sonication for 2h for nanopowders and 3h for nanotubes, while keeping the temperature below 65°C. The hardener is kept in vacuum while the mixture is being sonicated in order to extract some of the air bubbles;
Apply vacuum to the sonicated mixture for 2h at room temperature for the nanopowders and 3h at 65 °C for nanotubes in order to help extracting air bubbles;
Cool down (if necessary) the mixture and then mix it with the hardener for approximately 2 minutes;
Pour the mixture in silicon molds and keep in vacuum for 2h at room temperature before the thermal cycle is applied.
A few images of CNT’s (MWCNT), dispersed in epoxy, are presented in Figure 2. The images correspond to a sonication time of 20 and 100 minutes. It is clear that the dimensions of the clusters decrease as the sonication time increases.
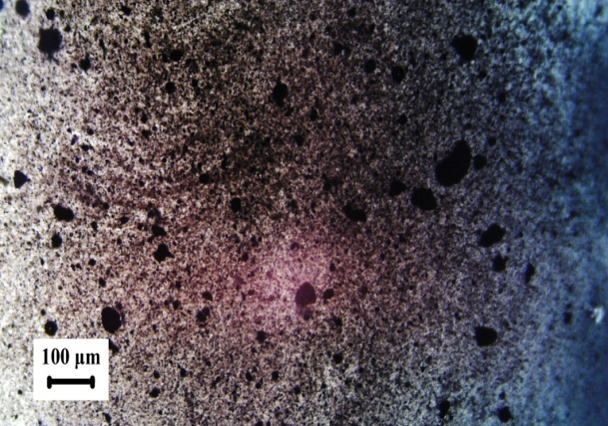 20 minutes
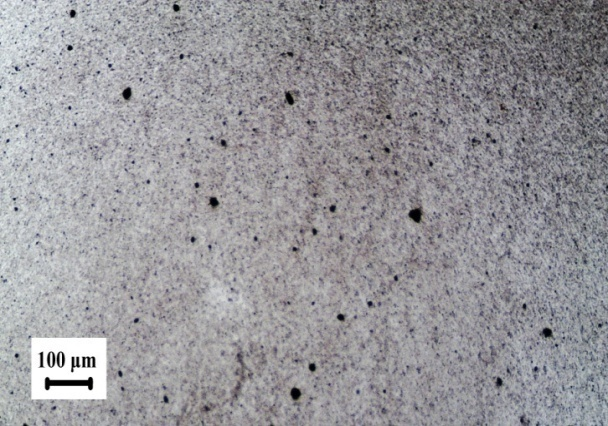 100 minutes
Characterization by mechanical testing
The fracture toughness of various samples (as indicated in Fig. 3) has been measured using SEN edge crack samples. The dashed line in the figure indicates the horizontal corresponding to pure epoxy. The graphene (GPL) samples have been produced at Rensselaer, while the CNT samples have been produced and tested at UPB. This plot underlines the importance of properly dispersing nanofillers in the matrix.
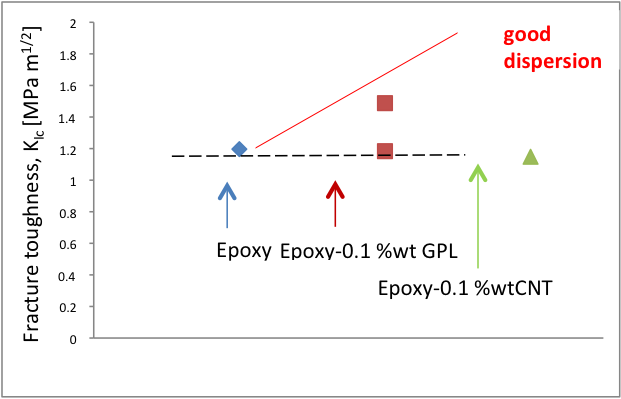
A good dispersion leads to an improvement of fracture toughness of almost 80 %. Preliminary studies showed that carbon nanotubes increase the fracture toughness through the mechanism known as crack bridging (a connection between the crack faces is obtained) which is well known in the literature on standard composites reinforced with microscopic fibers.
Interestingly, no similar enhancements are observed in the uniaxial, quasi-static tests. This has been observed before at Rensselaer, when testing epoxy filled with graphene (GPL).
More than 400 samples have been produced using different fillers. These include \(SiO_2\), \(Al_2O_3\), \(Fe_3O_4\), \(SnO_2\) and carbon nanotubes. A given sample contained only one type of filler. The concentration of \(SiO_2\) and \(Al_2O_3\) was varied from 0.1 to 0.5wt%, while that of \(Fe_3O_4\) and \(SnO_2\) was 0.3wt% in all cases. Some of the results obtained with alumina, silica and CNT fillers are shown in Figs. 4, 5 and 6.
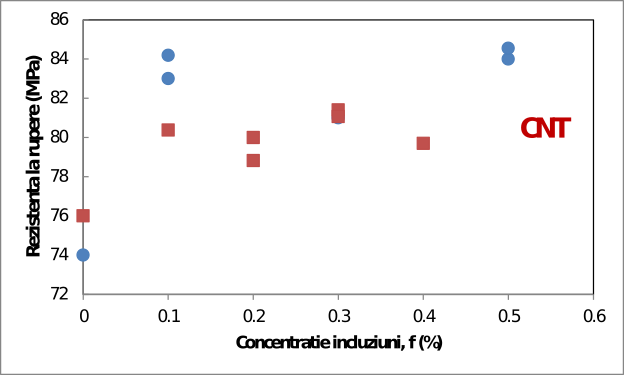
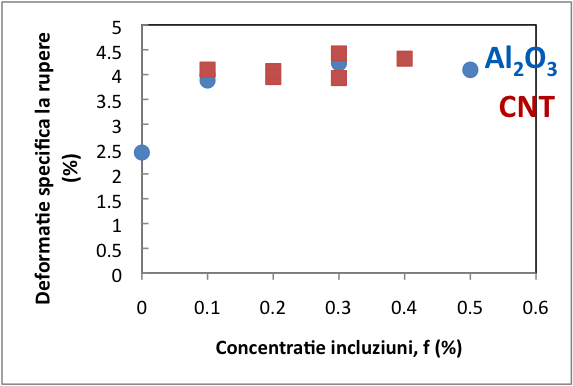
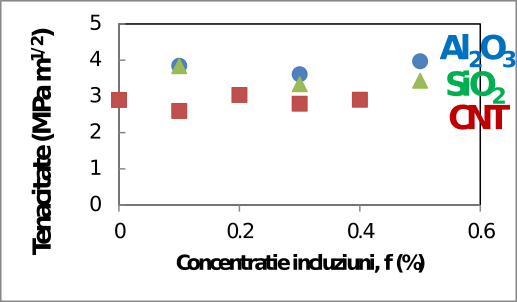
Figures 4 and 5 show increases in ductility and strength at small values of f, but no further variation as the filling fraction increases. No clear trend is observed for the fracture toughness.
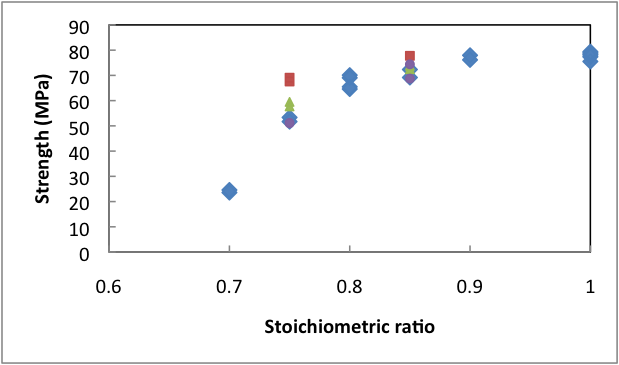
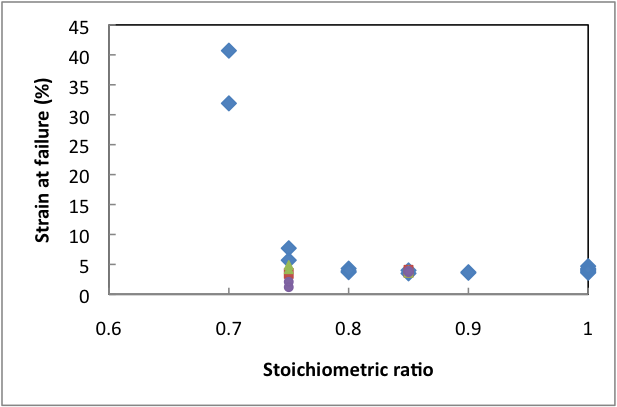
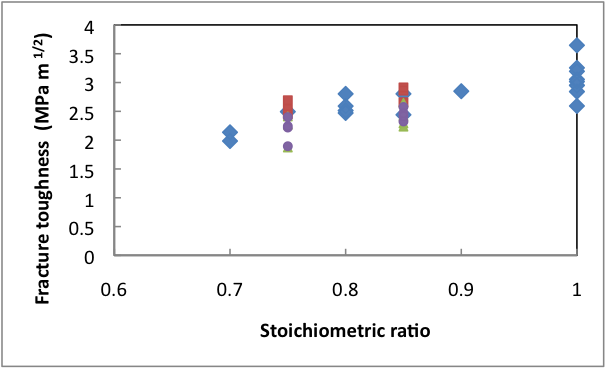
We also considered composites in which the matrix is not fully cured. To achieve this, we adjusted the amount of hardner, therefore controlling the stoichiometry ratio of the epoxy matrix. The strength, toughness and strain at failure are rather insensitive to the stoichiometric ratio for values above 0.8, but degrade quickly once the ratio decreases below 0.75. Figures 7,8 and 9 show the results for the pure resin (blue data points) and for the resin filled with CNT (red), alumina nanoparticles (small blue symbols) and silica nanoparticles (green). We observe that the filled systems respond to the variation of the stoichiometry similarly with the pure matrix.
Characterization by creep impact
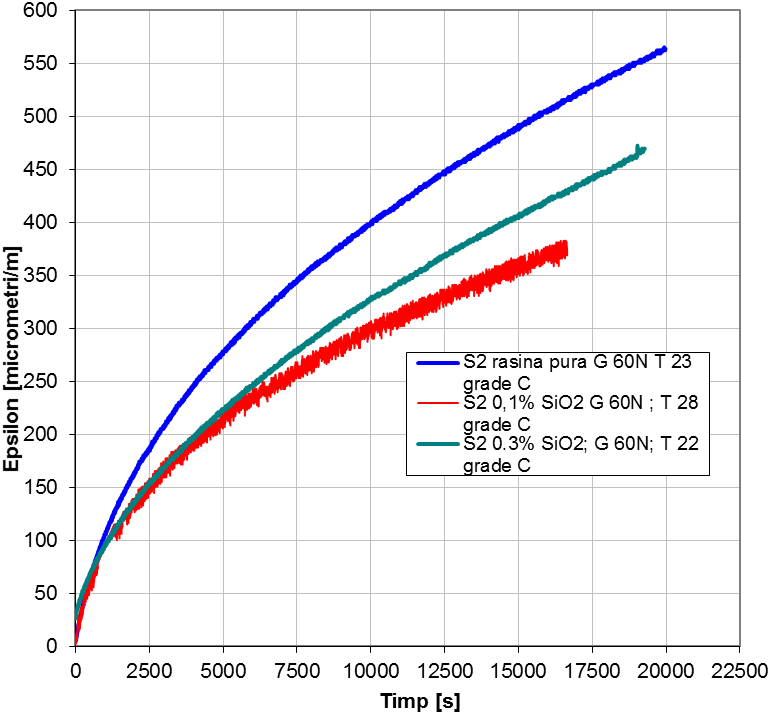
Creep and impact tests have been performed with pure epoxy and filled systems. Creep was performed at ambient and elevated temperatures and at two stress levels. Figure 10 shows three creep curves (strain versus time) for pure epoxy and epoxy filled with as-received \(SiO_2\) nanoparticles at 0.1wt% and 0.3wt% loading. The creep rate is reduced both in the transient regime and in steady state for the filled samples compared with the neat epoxy case. The effect is stronger for the smaller (0.1wt%) volume fraction, while for the large filling fraction the creep rate tends to return to that of pure epoxy.
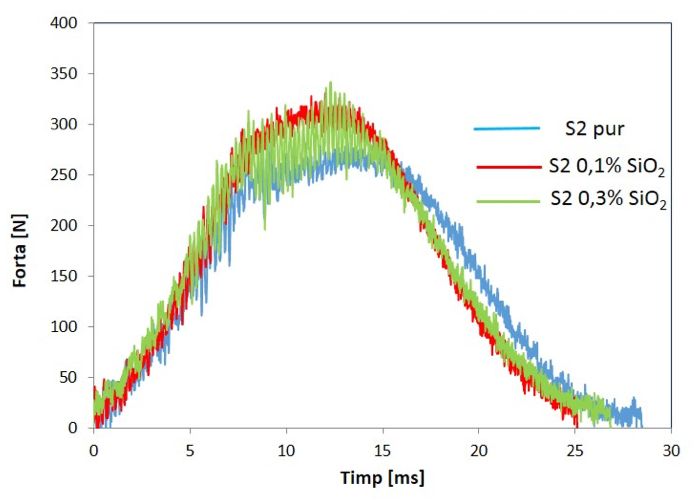
Testing at impact was performed with an instrumented impact tower at velocities between 0.8 and 1.2 m/s. Samples were placed in the 3-point bend configuration and tested at room temperature. The force, indenter velocity and total energy absorbed were measured. Figure 11 shows the force-time curves for the three systems discussed above (neat epoxy, epoxy with 0.1wt% and 0.3wt% \(SiO_2\)). The curve corresponding to pure epoxy shows a plateau at maximum force, associated with yielding, while the curve corresponding to epoxy-0.1wt% \(SiO_2\) has a more elastic response. The curve corresponding to poxy-0.3wt% silica is in-between the previous two curves.
When corroborating with the creep results of Fig. 10, it appears that the addition of silica renders the material more rate sensitive.
Characterization by microscopy
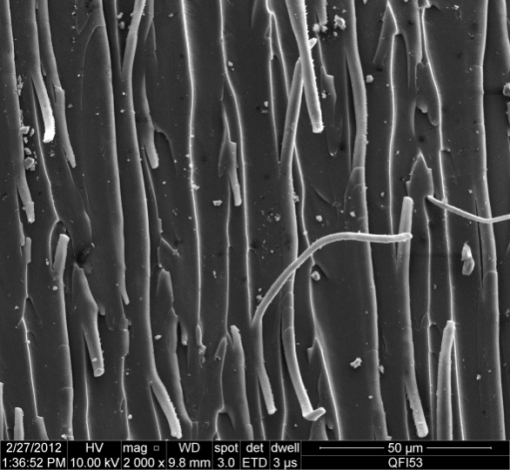
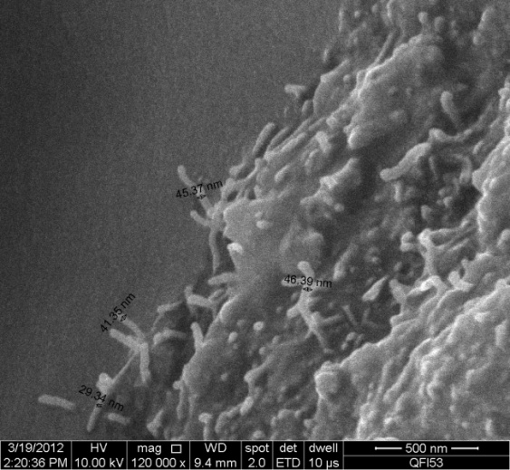
Figure 12 shows fracture surfaces of some of the composites tested. The fracture surface of pure epoxy is shown in Fig. 12 (left). The filaments observed in this image have diameter of several microns and are observed only in a sub-region of the fracture surface. We conjecture these features are due to a crack tip instability which occurs once the crack speed reaches a certain threshold. The fracture surface of epoxy-CNT is shown in Fig. 12 (right). Once can clearly see the CNTs (diameter of about 30-45 nm) being pulled out from the material. This justifies the toughness increase observed in Fig. 3, indicating the mechanism leading to this observation (crack bridging).
Conclusions from the Experimental Work
We have made substantial progress improving the processing method for epoxy-based nanocomposites.
Improvements have been observed in the fracture toughness, and in the case of epoxy filled with alumina, also in the strength and modulus.
0.1wt%
\(SiO_2\)nanopowder decreases the creep rate of epoxy, while larger wt% degrade the performance. This occurs despite the tensile mechanical behavior of epoxy-0.1wt%\(SiO_2\)composites is identical to that of pure epoxy.The addition of 0.1wt%
\(SiO_2\)makes the high strain rate material behavior more elastic than that of pure epoxy. Hence, the role of these nano-inclusions is to modify the strain rate sensitivity of the material.Direct observations of the fracture surface indicates CNT pull-out in some of our composites. The pull-out mechanism is well known in polymers filled with microscale fibers.
Modeling
Fractal and spatially correlated composite microstructures
The effect of correlations of the spatial distribution of inclusions in a two-phase composite is studied numerically in this work. Microstructures with fractal distribution of inclusions, characterized by long-range power law correlations, are compared with random inclusion distributions of same volume fraction. The elastic-plastic response of composites with stiff elastic inclusions and elastic-plastic matrix is studied.
Two phase, two-dimensional composites are considered. The matrix fills the Euclidean space of the problem domain. In each realization, inclusions form a fractal which is a generalization of the classical Cantor set to probabilistic structures embedded in 2D. The microstructure is constructed hierarchically by iteratively applying a set of transformation rules.
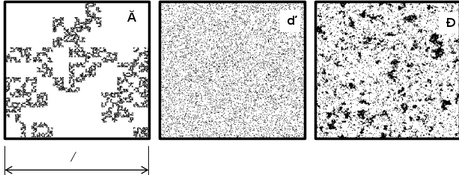
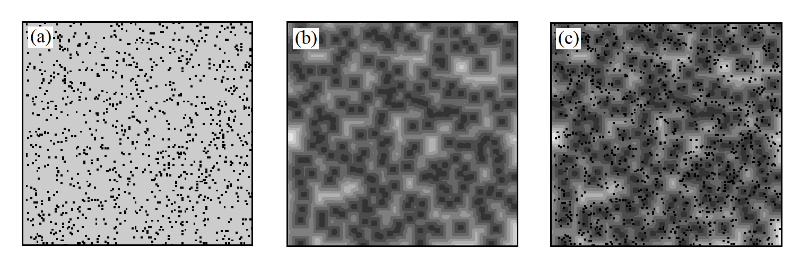
Composites with hierarchical multiscale structure with different distributions of inclusions are presented in Figure 13.The figure shows a microstructure in which inclusions form a fractal (a), a microstructure with randomly distributed inclusions (b), and a microstructure in which inclusions are distributed in a spatially correlated way, with the correlation being exponential.
The mechanical behavior of these composites was studied using finite
element models. The matrix was modeled with a bilinear model (linear
elastic of Young’s modulus \(E_1\)), and linear hardening beyond the yield
stress). Inclusions are considered linear elastic in all cases, with
Young’ s modulus \(6E_1\). The composite has also a bilinear response when
loaded uniaxially. The slope of the elastic region is denoted by \(E_e\)
(effective elastic modulus), while the slope of the stress-strain curve
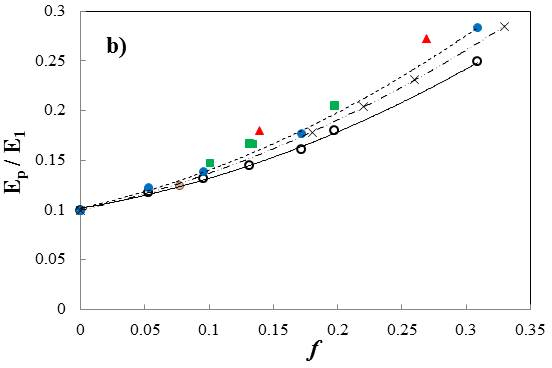
after the yield point is denoted by \(E_p\). Figure 14 shows the effective
moduli \(E_e\) and \(E_p\) for various systems. The open symbols show results
for the random microstructures. Each symbol represents the average of
100 realizations of the respective composite. The various filled symbols
represent results for fractal microstructures. As the fractal dimension
increases, the symbols move farther from the continuous black line which
was fitted to the open symbols. The yellow lines represent the
Hashin-Shtrikman bounds for the random microstructures. In (b), the
crosses represent data for the exponentially correlated microstructures
shown in Fig. 13(c).
It is concluded that the distribution of inclusions has a strong influence on the mechanical response of the composite. As the range of spatial correlations of the distribution increases, the composites are stiffer and strain harden more once in the plastic range.

The damping behavior of these composites has been studied in the second phase of the project. This is relevant for many applications in which composites are used to absorb energy. In such situations, it is useful to inquire how should the inclusions be distributed in order to obtain maximum damping at given volume fraction of filler material. The objective of this section is to provide a quantitative assessment of this issue and to determine the role of the spatial correlation of the distribution of inclusions in defining the damping behavior of the composite.
For subcritical damping, the damping ratio:
\[\zeta_{r} = - \frac{\sigma_{r}}{\sqrt{\sigma_{r}^{2} + \omega_{r}^{2}}}\]
is the ratio between the damping coefficient and the critical damping
coefficient for mode \(r\).
Figure 15 shows the damping ratio for the lowest eigenfrequency mode,
\(\zeta_{1}\), function of the volume fraction of inclusions for various
systems. The open symbols and the thick line correspond to the random
distribution of inclusions, while the other symbols correspond to
fractal microstructures with various fractal dimensions.
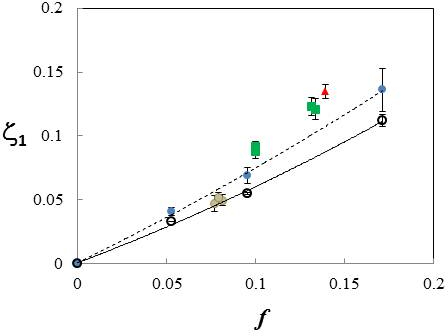
As the fractal dimension increases, the departure from the random case is more pronounced.
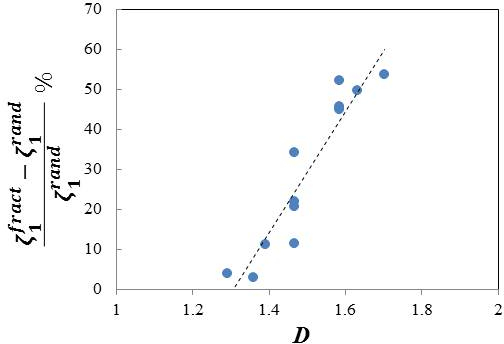
All fractal structures considered exhibit enhancements relative to the corresponding random cases, the increase being function of the fractal dimension. Figure 16 shows the percentage increase of the damping ratio relative to the random case of same volume fraction versus the fractal dimension, for all cases considered.
In conclusion, it is observed that composites with fractal microstructures are stiffer and have larger strain hardening rates, the effect increasing with the fractal dimension. A pronounced effect results when both materials are elastic, but energy dissipation is allowed within fillers. In this case, fractal microstructures dissipate up to 100% more energy than the random microstructures of same filler volume fraction.
Therefore, microstructures with long-range correlated distributions of inclusions are preferable in some applications, as they exhibit significantly different behavior relative to that of composites with random distribution of inclusions. The mechanical response of fractal microstructures depends on the range of scales of the fractal hierarchy and indirectly on the model size.
Effect of fluctuations in local material properties
The goal of the present study is to explore part of the design space associated with the composite composition. To this end, the constraint on the number of constituents in the composite is relaxed and we study the effect on the effective behavior of allowing spatial fluctuations of material properties, while keeping the mean of the distributions of these properties constant.
To this end, we consider three types of model composites (Fig. 17): Type 1 – composites with homogeneous elastic-plastic matrix and linear elastic inclusions of stiffness sampled from a distribution function. The mean of this distribution is kept constant and we investigate the effect of its variance on the homogenized response of the composite; Type 2 – composites with spatial variability in the elastic-plastic material parameters of the matrix, and with no inclusions. Similarly, the mean of the distribution is kept constant and the variable of the problem is its variance; Type 3 – composites of Type 2 in which inclusions are embedded. These inclusions are much smaller than the wavelength of matrix fluctuations and their stiffness is significantly higher than that of the matrix in all cases. All inclusions have the same stiffness in this case. In all models considered, the spatial distribution of inclusions and of matrix property fluctuations are random. This allows separating the effect of variability in the constituent properties from that of the spatial correlations.
For Type 1 composites we observe that Young’s modulus of the composite
decreases with increasing the coefficient of variation of the
distribution of inclusion stiffness, \(c_E\). This variation is shown in
Fig. 18 for two values of the filling fraction, \(f\). We also observe
that the strain hardening rate in the plastic range is not sensitive to
\(c_E\).
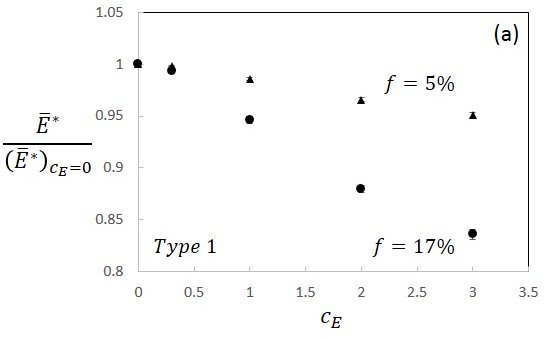
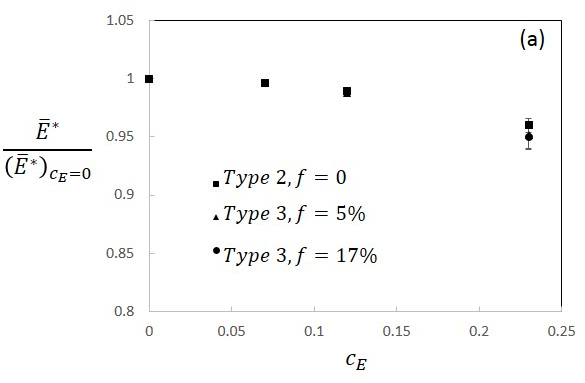
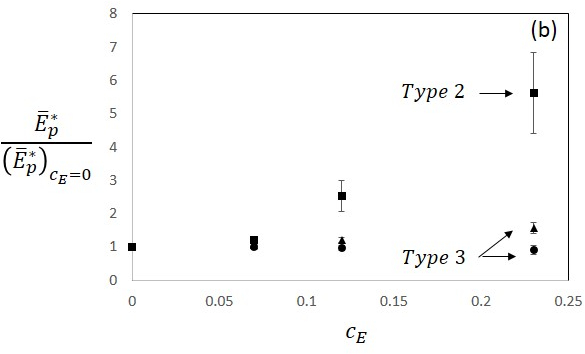
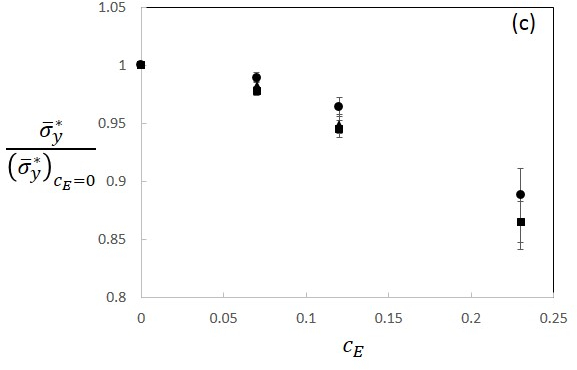
Figure 19 shows the effect of \(c_{E}\) on the effective modulus,
\({\overset{\overline{}}{E}}^{*}\), effective yield stress
\({\overset{\overline{}}{\sigma}}_{y}^{*}\) and effective strain
hardening, \({\overset{\overline{}}{E}}_{p}^{*}\), for Type 2 \((f = 0)\)
and Type 3 (\(f=5%\) and 17%) composites. Figure 19(a) shows the modulus
normalized with the modulus of the composite with no matrix
fluctuations. A much stronger softening effect is observed compared with
the Type 1 case (Fig. 18), with a relative decrease of 5% at a value of
\(c_{E}\) one order of magnitude smaller than that leading to the same
softening as in Fig. 18.
Matrix fluctuations lead to enhanced strain hardening,
\({\overset{\overline{}}{E}}_{p}^{*}\), which increases with increasing
\(c_{E}\) (Fig. 19(b)) for Type 2 composites. This effect is gradually
eliminated when the filler density, \(f\), increases. The effect of matrix
fluctuations on the effective yield stress is strong (Fig. 19(c)).
Fluctuations decrease the yield stress.
In conclusion, allowing spatial variability in the matrix constitutive properties or in the properties of the reinforcing phase leads to the reduction of Young’s modulus, the yield stress and of the strain hardening of the composite.
Graphene fillers: variation of their stiffness and strength with the concentration of defects
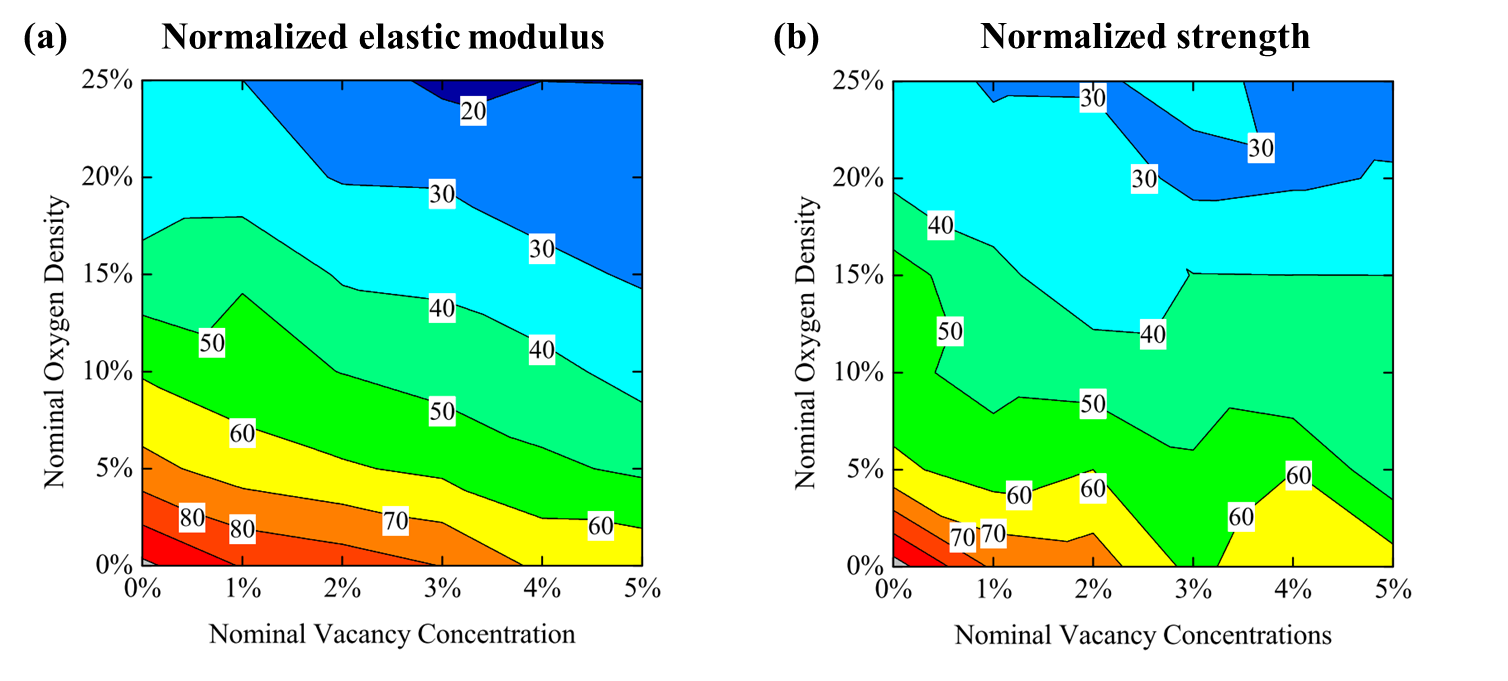
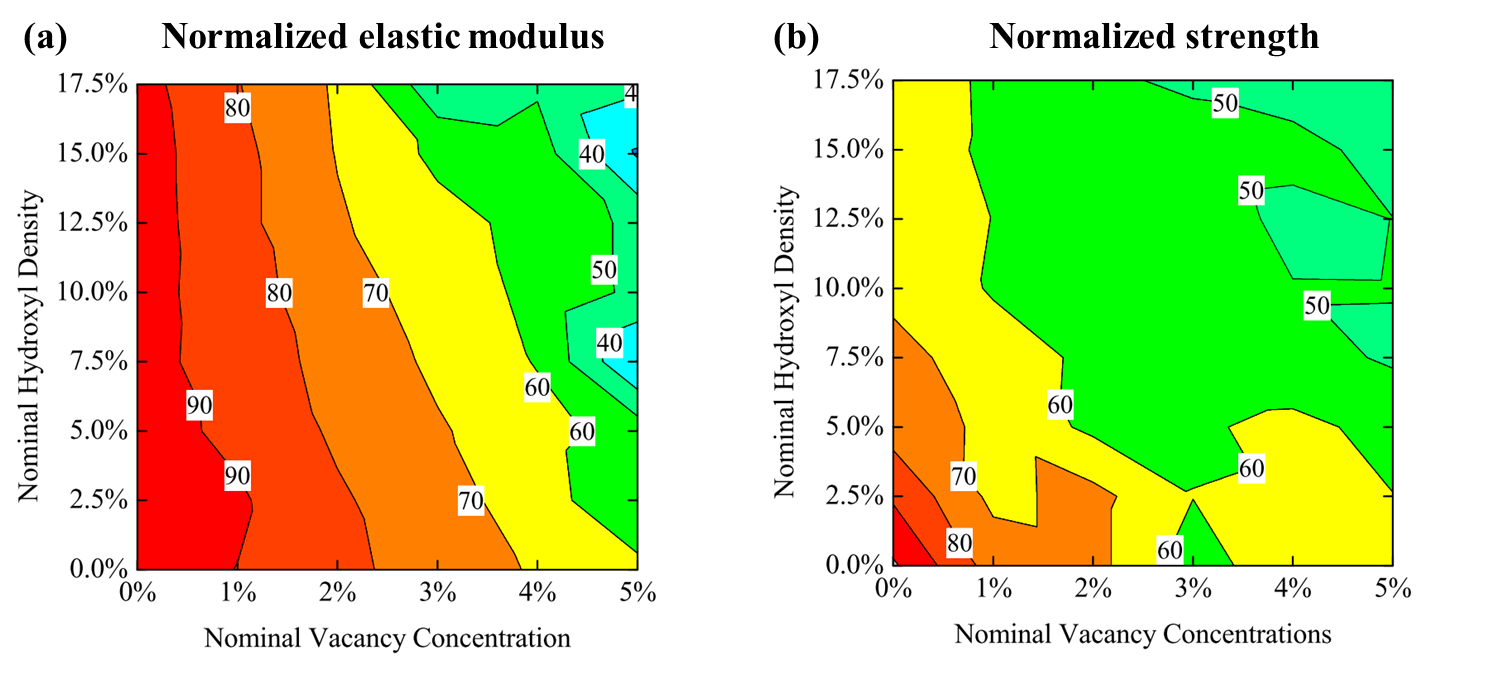
Graphene fillers are used to increase the stiffness, strength and toughness of thermoplastic and thermoset polymers. These have high intrinsic stiffness and strength when not defective. However, if no vacancies or functional groups are present, the polymers have poor adhesion to graphene and hence load transfer between matrix and fillers is poor. This affects the properties of the composite negatively.
We investigated using atomistic simulations the dependence of the graphene stiffness and strength on the presence of vacancies and of functional groups such as epoxy (O ad-atoms) and hydroxyl groups. The results are shown in Fig. 20 for graphene containing vacancies and epoxide groups and in Fig. 21 for graphene with vacancies and hydroxyl groups. The contours represent the percentage of the strength/stiffness of the defective graphene relative to the pristine graphene case.
Resources
The tools currently available in our lab are listed below:
Shear mixer: ARE-250, manufactured by Thinky Co., Japan; maximum mixing speed 2000 rpm.
Sonicator: Sonics VCX-750, manufactured in USA, power 750W, frequency converter of 20 kHz, and sonication temperature control; the sonicatoris able to stop when the limit temperature is reached. An additional, home-made cooling system is also used to ensure proper temperature stability during sonication.
Vacuum oven: MEMMERT VO400, manufactured in UK, may be programed to use up to 40 different ramps. The vacuum pump is of typeIlmac MPC 310 Z, with a flow of 38 l/min, 8 mbar. The vacuum pump is placed in a soundproof container (PM400).
Mechanical testing system: Walter+bai 50 kN, performs static and fatigue testing, uses Epsilon extensometers.
Mechanical testing system: Zwick10 kN, performs static testing.
ARAMIS system: The system uses the digital image correlation method (DIC) to measure the displacement field on the sample surface. It is fitted with a TITANAR A2 lens having 100 mm fixed focal length. The field of view has dimensions of 15 x 11 mm, and the depth of focus is 1.5 mm.
Optical Microscope: CelestronPentaview with a maximum magnification of 600x, is used for low magnification observations of the dispersion. High magnification observations are performed with a scanning electron microscope (SEM) to which we have access.
3D Rapid Prototyping 3D Systems CubePro dual printer
Impact Tower Instron CEAST 9340, instrumented, max impact velocity 4.62 m/s, max dropping mass 37.5 Kg, max potential energy 405 J.
Publications
Journal Articles
- [1]C. R. Picu, Z. Li, M. A. Soare, S. Sorohan, D. M. Constantinescu, and E. Nutu, “Composites with fractal microstructure: The effect of long range correlations on elastic–plastic and damping behavior,” Mechanics of Materials, vol. 69, no. 1, pp. 251–261, Feb. 2014.
The effect of correlations of the spatial distribution of inclusions in a two-phase composite is studied numerically in this work. Microstructures with fractal distribution of inclusions, characterized by long-range power law correlations, are compared with random inclusion distributions of same volume fraction. The elastic–plastic response of composites with stiff elastic inclusions and elastic–plastic matrix is studied, and it is concluded that fractal microstructures always lead to stiffer composites, with higher strain hardening rates, compared with the equivalent composites with randomly distributed inclusions. Composites with filler distributions characterized by shorter range, exponential correlations exhibit behavior intermediate between that of random and power law-correlated microstructures. Larger variability from replica to replica is observed in the fractal case. The pressure in inclusions is larger in the case of fractal microstructures, indicating that these are expected to be advantageous in applications such as toughening of thermoset polymers which takes place via the cavitation mechanism. The effect of the spatial distribution of inclusions on the effective damping of the composite is also investigated. The matrix is considered elastic and non-dissipative, while inclusions dissipate energy. The composite with fractal microstructure provides more damping than the random microstructure of same filler volume fraction, and the effect increases with increasing fractal dimension. When damping is introduced only in the interfaces between matrix and inclusions, the spatial distribution of fillers becomes inconsequential for the overall composite behavior. These results are relevant for the design of composites with hierarchical multiscale structure.
- [2]I. Cosmoiu, D. A. Apostol, C. R. Picu, D. M. Constantinescu, and M. Sandu, “Manufacturing and testing of nanocomposites with carbon nanotubes and nanoparticles,” U.P.B. Sci. Bull., vol. 77, no. 7, pp. 107–119, 2015.
- [3]C. R. Picu, S. Sorohan, M. A. Soare, and D. M. Constantinescu, “Towards designing composites with stochastic composition: Effect of fluctuations in local material properties,” Mechanics of materials, vol. 97, pp. 59–66, Jun. 2016.
- [4]A. Zandiatashbar, E. Ban, and C. R. Picu, “Stiffness and strength of oxygen-functionalized graphene with vacancies,” Journal of Applied Physics, vol. 116, no. 18, p. 184308, Nov. 2014.
The 2D elastic modulus (E2D) and strength (σ2D) of defective graphene sheets containing vacancies, epoxide, and hydroxyl functional groups are evaluated at 300 K by atomistic simulations. The fraction of vacancies is controlled in the range 0% to 5%, while the density of functional groups corresponds to O:C ratios in the range 0% to 25%. In-plane modulus and strength diagrams as functions of vacancy and functional group densities are generated using models with a single type of defect and with combinations of two types of defects (vacancies and functional groups). It is observed that in models containing only vacancies, the rate at which strength decreases with increasing the concentration of defects is largest, followed by models containing only epoxide groups and those with only hydroxyl groups. The effect on modulus of vacancies and epoxides present alone in the model is similar, and much stronger than that of hydroxyl groups. When the concentration of defects is large, the combined effect of the functional groups and vacancies cannot be obtained as the superposition of individual effects of the two types of defects. The elastic modulus deteriorates faster (slower) than predicted by superposition in systems containing vacancies and hydroxyl groups (vacancies and epoxide groups).
- [5]D. M. Constantinescu, D. A. Apostol, I. Cosmoiu, and M. Sandu, “Investigations on the behavior of MWNT epoxy nanocomposites: static and toughness testing,” Buletinul Universitatii Petrol si Gaze Ploiesti, vol. LXV, pp. 43–48, 2013.
- [6]I. Cosmoiu, D. A. Apostol, D. M. Constantinescu, C. R. Picu, and M. Sandu, “Advances on the Manufacturing Process of Nanocomposites with MWNT and Nanopowders,” Applied Mechanics and Materials, vol. 760, pp. 281–286, May 2015.
- [7]E. Ban and C. R. Picu, “Elasticity, thermal conductivity and thermoelectric power of random composites,” Journal of the Mechanics and Physics of Solids (submitted), 2016.
- [8]C. R. Picu, V. Negi, and J. Merson, “Ultra-composites: designing stochastic composites with large microstructural variability,” Romanian Journal of Technical Sciences Applied Mechanics, vol. 61, no. 1, 2016.
Conferences
- [1]C. R. Picu, A. Shahsavari, and L. Zhang, “Mechanics of fibrous materials,” Providence, RI, USA, 2013.
- [2]C. R. Picu, M. A. Soare, S. Sorohan, and D. M. Constantinescu, “Controlling microstructural stochasticity in composites for enhanced mechanical properties,” in ESMC2015, Leganes-Madrid, 2015.
- [3]C. R. Picu et al., “Al-SiC nanocomposites produced by ball milling and spark plasma sintering,” in 2012 Materials Research Society Fall Meeting & Exhibit, Boston USA, 2012, pp. 25–30.
- [4]D. M. Constantinescu, C. R. Picu, D. A. Apostol, CosmoiuIoana, and M. Sandu, “Investigations on the behaviour of MWNT epoxy nanocomposites: static and toughness testing,” Ploieşti, Romania, 2012.
- [5]C. R. Picu, Z. Li, M. A. Soare, S. Sorohan, and D. M. Constantinescu, “Influence of the spatial distribution of heterogeneity on the mechanical behavior of hierarchical composites,” Nassau, Bahamas, 2013.
- [6]D. M. Constantinescu, C. R. Picu, and D. A. Apostol, “Evaluation of the fracture toughness of MWNT and GPL epoxy nanocomposites,” in Proceedings of the 29th Danubia-Adria-Symposium on Advances in Experimental Mechanics, Belgrade, Serbia, 2012.
- [7]C. R. Picu, D. M. Constantinescu, M. Sandu, M. A. Apostol, and I. Cosmoiu, “Toughness Enhancement in Nanocomposite Thermosets with Application to Carbon-Epoxy System,” China, 2013.
- [8]M.-C. Miron, D. M. Constantinescu, Z. Major, and C. Picu, “Loading influence on the local strain fields of an interface crack in a DCB sandwich composite,” in ECF19, 2013.
- [9]C. R. Picu and A. Zandiatashbar, “Mechanical behavior of graphene-epoxy nanocomposites,” Graz, Austria, 2012.
- [10]S. Sorohan, M. Sandu, D. M. Constantinescu, A. Sandu, and D. A. Apostol, “Static response of an anti-tetrachiral sandwich panel, Danubia-Adria Symposium on Advances in Experimental Mechanics,” Primosten, Croatia, 2013.
- [11]I. Cosmoiu, D. A. Apostol, D. M. Constantinescu, C. R. Picu, and M. Sandu, “Advances on the Manufacturing Process of Nanocomposites with MWNT and Nanopowders,” in Applied Mechanics and Materials, Bucureşti, 2014.
- [12]C. R. Picu, Z. Li, M. A. Soare, S. Sorohan, and D. M. Constantinescu, “When are hierarchical stochactic microstructures desirable?,” Boston, MA, USA, 2013.
- [13]C. R. Picu, V. Negi, M. Islam, and S. Sorohan, “Ultra-composites: multiphase composites with long-range correlations of microstructural heterogeneity distribution,” University of Maryland, 2016.
- [14]I. Cosmoiu, D. A. Apostol, C. R. Picu, D. M. Constantinescu, M. Sandu, and S. Sorohan, “Influence of Filler Dispersion on the Mechanical Properties of Nanocomposites,” in Materials Today: Proceedings, 2016, vol. 3, pp. 953–958.